Immediate — Open to relocation

ParthBadiger

Turning raw data into strategic decisions. Business Analytics MSc — University of Exeter.

Parth Badiger
Belagavi, Karnataka, IndiaOpen to roles
0+
Projects
0+
Internships
0+
Industries
01About

Impact first. Models second.

At Bajaj Auto, I built customer segmentation models that boosted targeted campaign conversions by 25%. At Croma, I designed Power BI dashboards that cut stakeholder reporting time by 40%. These aren't academic exercises — they're business outcomes from real internships at consumer-facing brands.

I'm a Business Analytics MSc graduate from the University of Exeter (Russell Group · QS World #153), where I completed a thesis-grade ML pipeline analysing 100K+ e-commerce orders. My toolkit spans the full analytics spectrum: Python and R for modelling, Power BI, Tableau, and Google Data Studio for storytelling, SQL for extraction, Excel Solver for optimisation, and business acumen for framing the "so what?"

From global development indicators to stadium ticket pricing, from NLP sentiment analysis to DEA efficiency benchmarking — I don't just build models, I build models that answer real business questions across industries.

Master of Science
Business Analytics
University of Exeter, United Kingdom
Jan 2025 – 2026 · Graduated — May 2026
Russell Group · QS World #153
  • Machine Learning
  • Operations Analytics
  • Marketing Analytics
  • Database Technologies
  • Programming (Python, R)
India Global Leaders Scholarship Recipient
Bachelor of Business Administration
Business Analytics
K.L.E. College of Business Administration, India
2021 – 2024 · GPA 7.68 / 10
  • Business Analytics
  • Market Research
  • Data Analysis
Based in
Belagavi, Karnataka, India
Availability
Immediate — Open to relocation
02Differentiator

What I Bring That Others Don't

01
End-to-end ML pipelines, not just model outputs

From raw data wrangling to stakeholder-ready visualisations — I deliver the full pipeline, not isolated notebooks.

02
Internship impact at two consumer-facing brands

Most graduates list coursework. I shipped segmentation models at Bajaj Auto and dashboards at Croma that influenced real business decisions.

03
Fluent across 4+ BI platforms — not just one tool

Power BI, Tableau, Google Data Studio, and Excel Solver — I pick the right tool for the problem, from interactive dashboards to LP optimisation models.

04
India Global Leaders Scholarship — top academic cohort

Selected for a merit-based scholarship at a Russell Group university (QS World #153), competing against applicants globally.

03Experience

Where I've Made an Impact

2023
Apr 2023 – May 2023
Karnataka, India

Market Research Analyst Intern

Bajaj Auto
  • 01Developed customer segmentation models using cluster analysis and conjoint analysis across 200+ survey respondents, identifying 3 distinct behavioural profiles.
  • 02Boosted targeted campaign conversion rates by 25% through data-driven recommendations on personalised messaging.
  • 03Presented segmentation findings and projected marketing ROI to senior stakeholders, informing Q4 campaign budget allocation.
Customer SegmentationCluster AnalysisPythonSPSS
2022
Nov 2022 – Dec 2022
Karnataka, India

Retail Analyst Intern

Infiniti Retail (Croma)
  • 01Delivered 3 actionable recommendations from customer data analysis, contributing to 15% improvement in operational efficiency.
  • 02Built interactive Power BI and Google Data Studio dashboards, cutting stakeholder reporting preparation time by ~40%.
  • 03Gathered requirements from business teams to align dashboard outputs with operational KPIs.
Power BIGoogle Data StudioKPI DashboardsReporting
04Selected Work

Projects

01Business Intelligence

TheLook E-Commerce Analytics & BI

Production-Grade Analytics Pipeline — Python · SQL · Power BI

Transformed 125K orders, 100K users, and $10.76M in raw Google BigQuery data into an enterprise MySQL Kimball star schema, 9 SQL deep-dive query scripts, and a 2-page dark-mode Power BI executive dashboard.

So What

Identified that Outerwear & Sweaters yielded the highest profit margin ($1.8M+) but suffered an 11.2% return rate, while Organic/Search acquisition channels produced 2.4x higher CLV compared to Social campaigns.

  • Ingested & profiled 7 raw BigQuery tables using custom Python data engineering scripts
  • Architected Kimball-style MySQL Star Schema (1 Fact table, 3 Dimension tables)
  • Executed 9 SQL analytics deep dives (Cohort retention, RFM segmentation, AOV, Margin analysis)
PythonMySQLPower BIDAXSQLPandasSeaborn
GitHub
02Machine Learning

E-Commerce Satisfaction Prediction & Seller Benchmarking

MSc Dissertation — University of Exeter

Built an end-to-end analytics pipeline for Olist marketplace data (100K+ orders), predicting customer satisfaction and benchmarking seller performance to inform marketplace growth strategy.

So What

Identified that delivery speed and geographic proximity to logistics hubs were the strongest predictors of customer satisfaction — suggesting marketplace expansion should prioritise regions with existing fulfilment infrastructure.

  • Full ML pipeline: data prep → EDA → geographic analysis → prediction → seller benchmarking
  • XGBoost classifier with RandomizedSearchCV and 5-fold StratifiedKFold cross-validation
  • Statistical tests: Mann-Whitney U, Spearman correlation
PythonXGBoostLogistic RegressionKMeansSMOTEScikit-learn
GitHub
03NLP / Deep Learning

Sentiment Analysis with NLP

RoBERTa Fine-Tuning on IMDb Reviews

Most companies using off-the-shelf sentiment tools get generic results. I fine-tuned a domain-adapted RoBERTa transformer that outperforms standard ML approaches by 12 percentage points — giving businesses more reliable customer voice data at scale.

So What

Demonstrated that transfer learning with domain-specific fine-tuning can replace expensive manual sentiment labelling, reducing the cost of customer feedback analysis significantly.

  • 88.5% accuracy using transfer learning with RoBERTa
  • Baseline comparisons: Logistic Regression (TF-IDF), Naive Bayes
  • Full pipeline: preprocessing, tokenization, fine-tuning, evaluation
PythonPyTorchHuggingFaceRoBERTaNLP
GitHub
04Machine Learning

Car Price Prediction Model

XGBoost & Random Forest Regression

Developed and benchmarked XGBoost and Random Forest regression models on 10,000 used-car listings, demonstrating that structured tabular data with strong pricing signals (mileage, age, brand tier) can yield highly accurate valuations.

So What

Validated on an 80/20 train-test split with R² of 0.97 on held-out data — the strong fit is driven by low-noise pricing signals (mileage, brand, age) in a well-structured marketplace dataset, not overfitting.

  • R² 0.97 on test set — validated with train-test split to rule out overfitting
  • Engineered 15+ features from raw categorical and numerical data
  • Feature importance analysis revealed mileage, brand, and age as top 3 predictors
PythonXGBoostRandom ForestScikit-learnPandas
GitHub
05Operations Research

Stadium Ticket Revenue Optimisation

Linear Programming — BCFC

Formulated a linear programming model to maximise stadium ticket revenue under promotional inventory and seating constraints.

So What

Optimal allocation yielded £4.85M — a meaningful improvement over the existing ad hoc pricing policy — with the solution remaining robust under ±10% demand fluctuations, giving management confidence to implement.

  • Optimal solution: £4.85M revenue identified
  • Sensitivity analysis for ±10% demand fluctuations
  • Constraint optimization for seat allocation strategy
Excel SolverLinear ProgrammingSensitivity Analysis
GitHub
06Marketing Analytics

Marketing Analytics — Chestnut Ridge

Customer Segmentation in R

Comprehensive R-based marketing analytics pipeline featuring hierarchical clustering, k-means segmentation, and radar chart visualizations for strategic segment profiling.

So What

Identified a high-value customer segment that was under-targeted in current campaigns, providing a clear rationale for reallocating marketing spend toward the most profitable audience.

  • Hierarchical clustering (Ward's D2) + k-means with silhouette analysis
  • GE Matrix Analysis with custom attractiveness scoring
  • 4-cluster solution with complete segment profiling
Rggplot2clusterfactoextraNbClust
GitHub
07Operations Research

Operations Analytics — DEA & Linear Programming

Efficiency Benchmarking & Resource Optimisation

Conducted Data Envelopment Analysis (DEA) for efficiency benchmarking across operational units and built linear programming models for resource allocation optimisation as part of MSc Operations Analytics coursework at University of Exeter.

So What

Surfaced underperforming units that appeared efficient by traditional metrics but were exposed by DEA's multi-input/output framework — enabling targeted process improvement rather than blanket cost-cutting.

  • DEA benchmarking across 10+ operational units to identify underperformers
  • Crop allocation LP model achieving 20% cost minimisation vs baseline
  • Network flow optimisation using Excel Solver for supply chain cost reduction
Excel SolverRLinear ProgrammingDEASensitivity Analysis
GitHub
08Business Intelligence

Wearable Devices Market Analytics Dashboard

Interactive Tableau Dashboard

Designed interactive Tableau dashboards for wearable devices market analysis, visualising market trends, brand comparisons, and consumer adoption patterns across product categories.

So What

Revealed that mid-tier wearable brands were gaining market share faster than premium players in emerging markets — a trend not visible in aggregate industry reports but clear through drill-down regional analysis.

  • Interactive visualisations with drill-down filters for brand, category, and time
  • Market share distribution and growth trend analysis across device segments
  • Data storytelling best practices applied for executive-level presentation
TableauData VisualizationDashboard Design
GitHub
09Business Intelligence

World Bank Development Indicators Dashboard

Google Data Studio — 2000–2021 Global Analysis

Built an interactive Google Data Studio dashboard analysing 20+ years of World Bank development indicators across multiple countries, visualising trends in economic growth, health, education, and infrastructure.

So What

Enabled comparative country-level analysis that surfaced diverging development trajectories between nations with similar starting conditions — highlighting the outsized impact of health and education investment on long-term GDP growth.

  • Drill-down filters by country, region, year, and indicator category
  • Key metrics: GDP growth, population, health expenditure, education enrollment
  • Geo-maps, scorecards, and time-series trend lines across 200+ countries
Google Data StudioData VisualizationData Cleaning
GitHub
05Skills

Tools & Methods

Agile & Project Management
  • Agile
  • Scrum
  • Kanban
  • Sprint Planning
  • Backlog Refinement
  • Jira / Confluence
  • Requirements Gathering
  • SWOT Analysis
Programming & Databases
  • Python
  • R
  • SQL
  • MySQL
  • Pandas
  • NumPy
  • Scikit-learn
BI & Visualization
  • Power BI
  • Tableau
  • Google Data Studio
  • Matplotlib
  • Seaborn
  • Excel (Solver, Pivots)
Machine Learning & AI
  • XGBoost
  • Random Forest
  • Logistic Regression
  • NLP / Transformers
  • KMeans Clustering
  • SMOTE
Analytics Methods
  • Customer Segmentation
  • Linear Programming
  • Statistical Testing
  • Hypothesis Testing
  • Forecasting
  • Data Envelopment Analysis
06Certifications

Credentials & Training

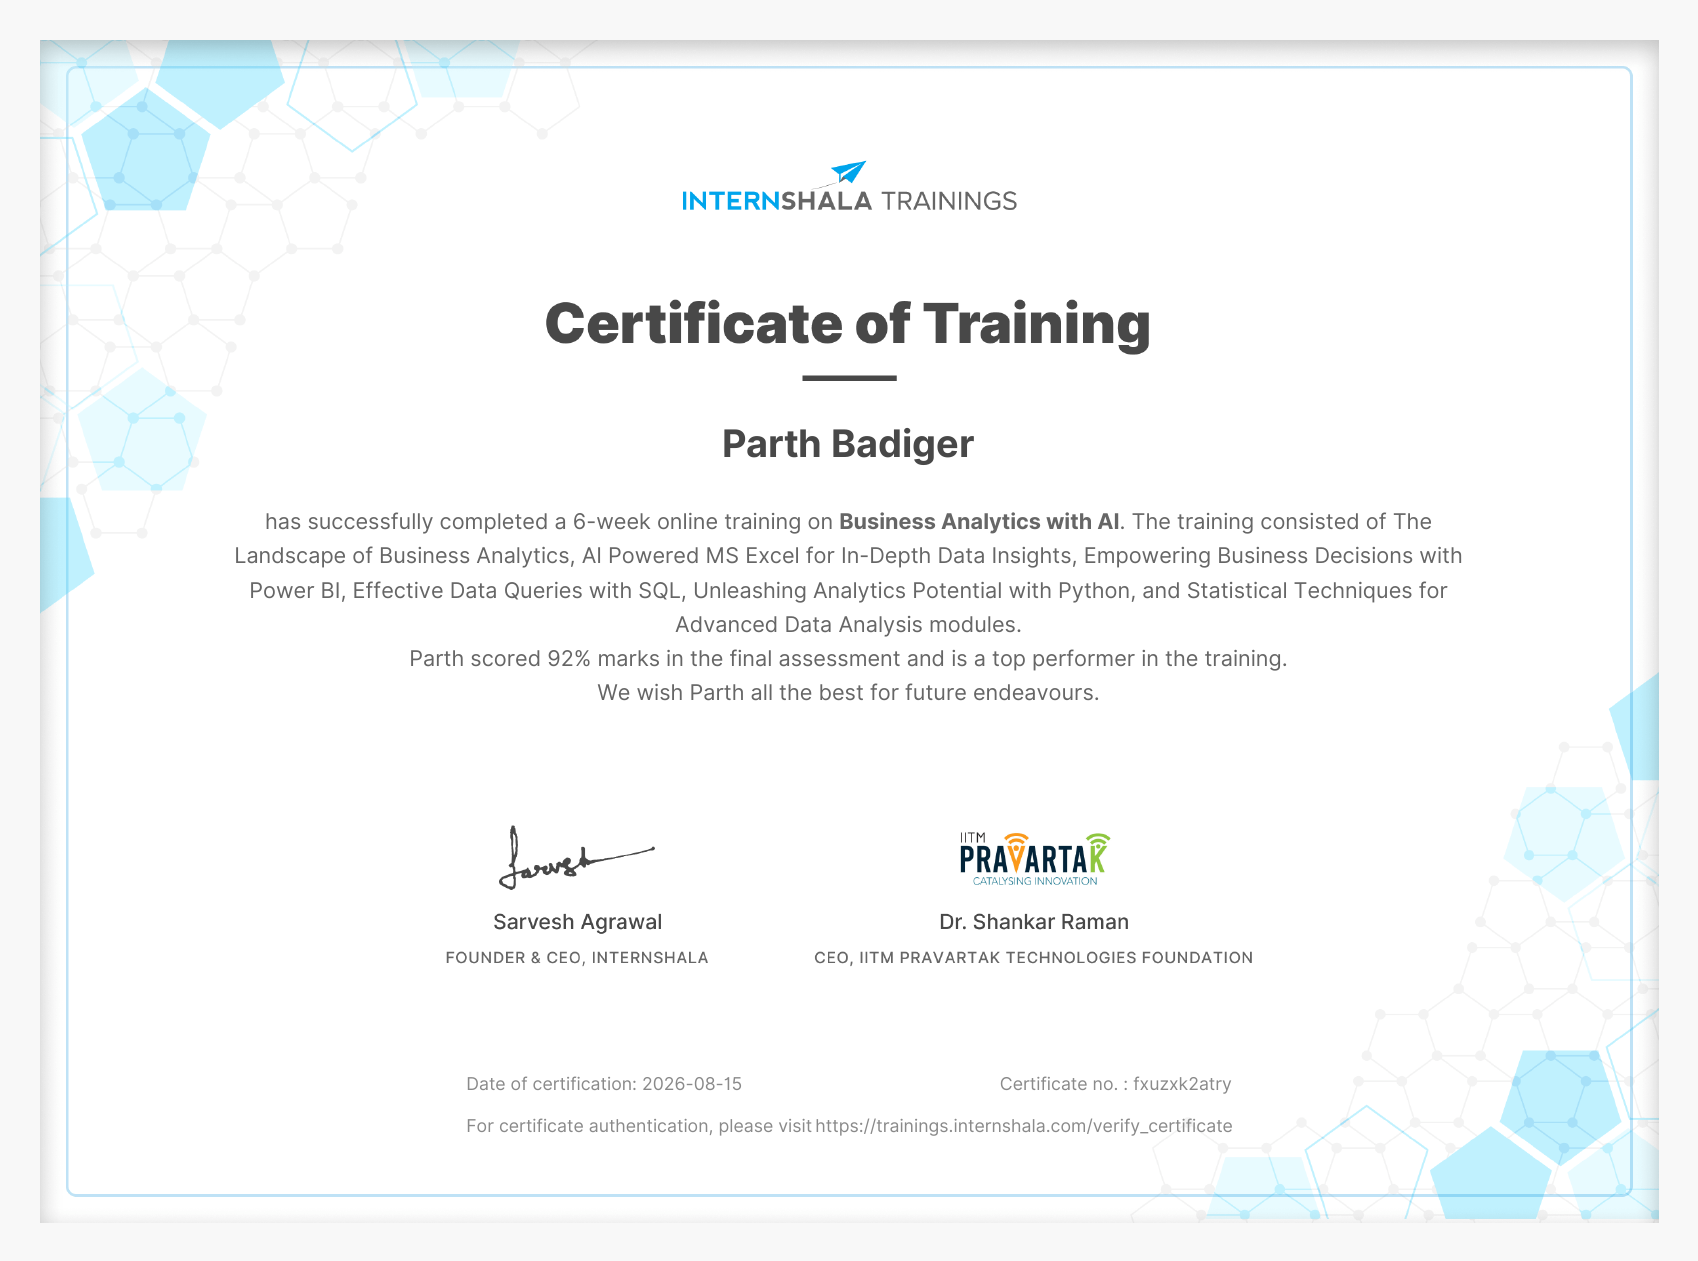
Business Analytics with AI (Top Performer — 92%)
Internshala Trainings × IITM Pravartak
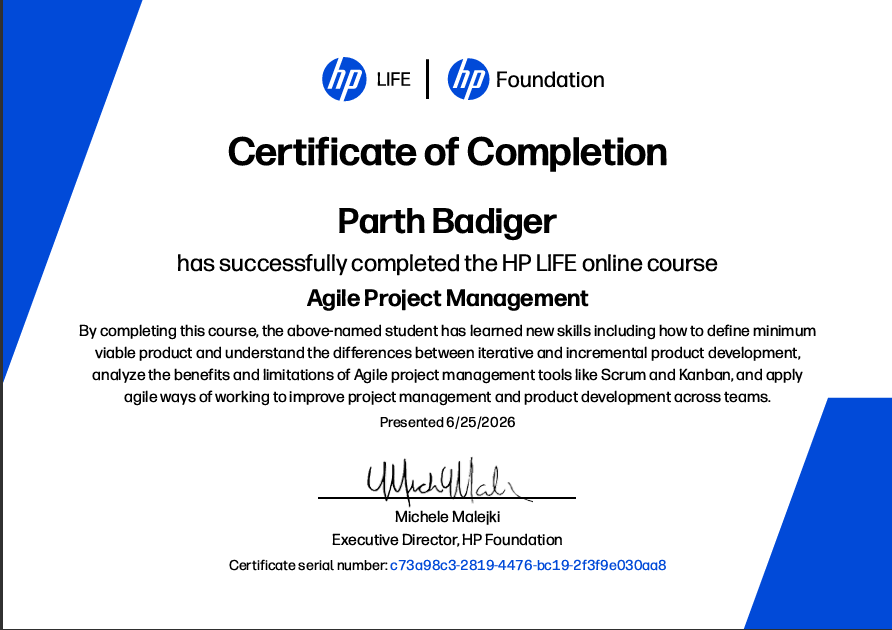
Agile Project Management
HP LIFE / HP
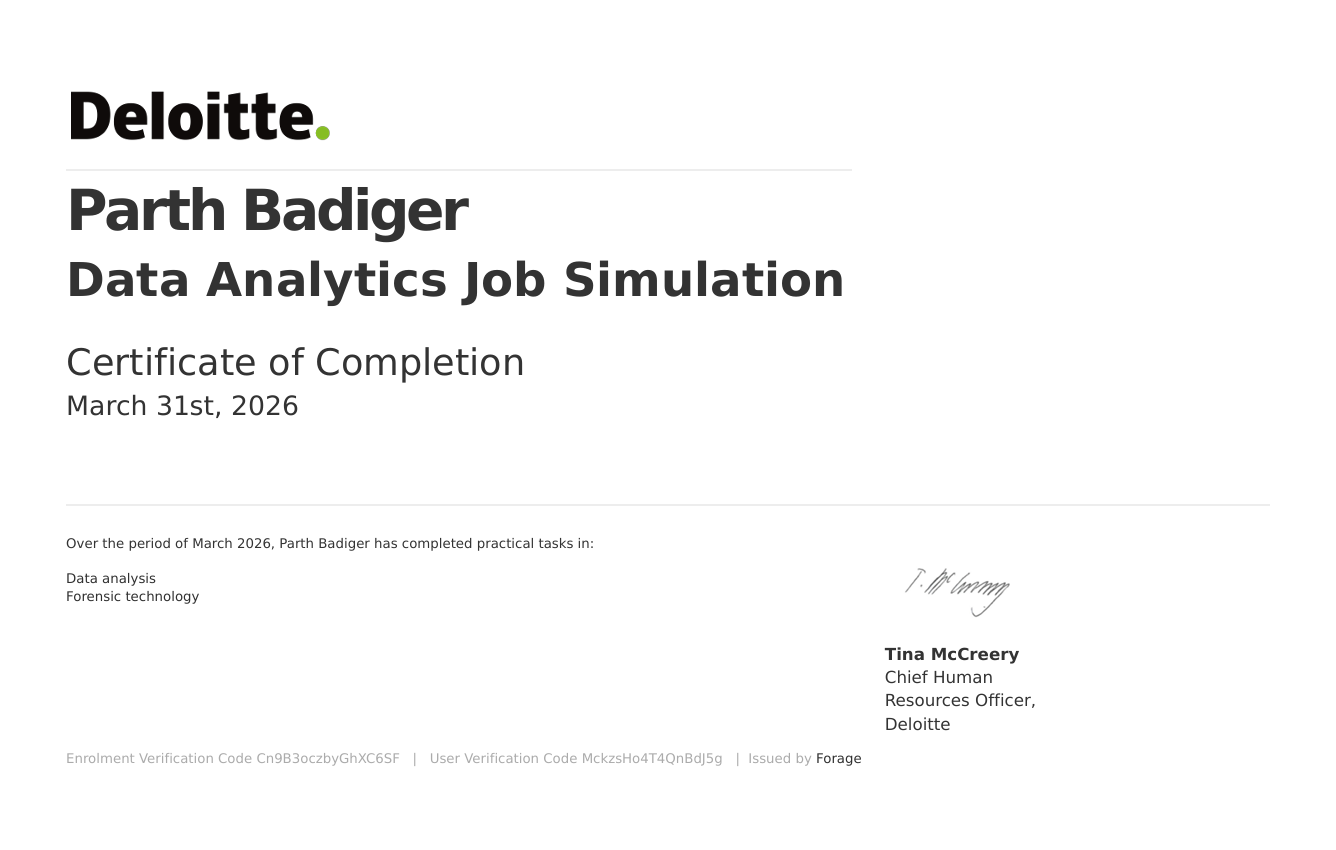
Deloitte Data Analytics Job Simulation
Forage / Deloitte
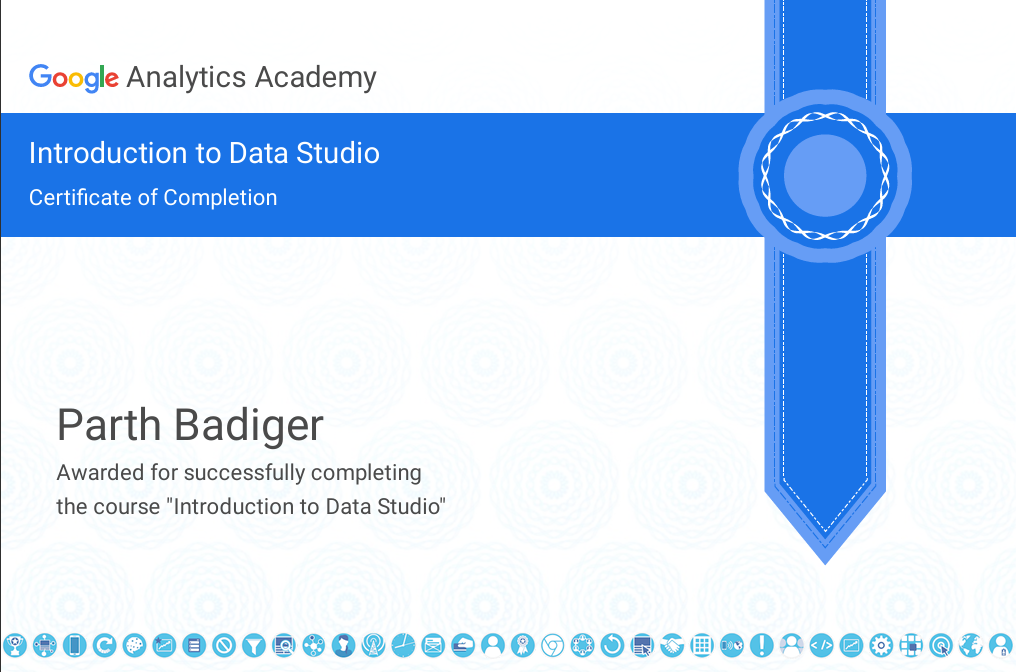
Google Data Studio Certification
Google
Python Proficiency (ExCode)
University of Exeter
Tally ERP 9.0 Certification
Shri Saraswati Infotech
Google Analytics Certification
Google
07 / Contact

Let's Work Together

I'm actively looking for Data Analyst, Business Analyst, and BI Analyst roles. Open to immediate relocation within India — no sponsorship required. If you think I'd be a good fit for your team, let's connect.

Location
Belagavi, Karnataka, India
Status
Available to start immediately. Open to relocation.